
Severe Weather Outbreak Potential for Southern United States
Issued April 10 2020 – 3:30 PM
FORECAST DISCUSSION:
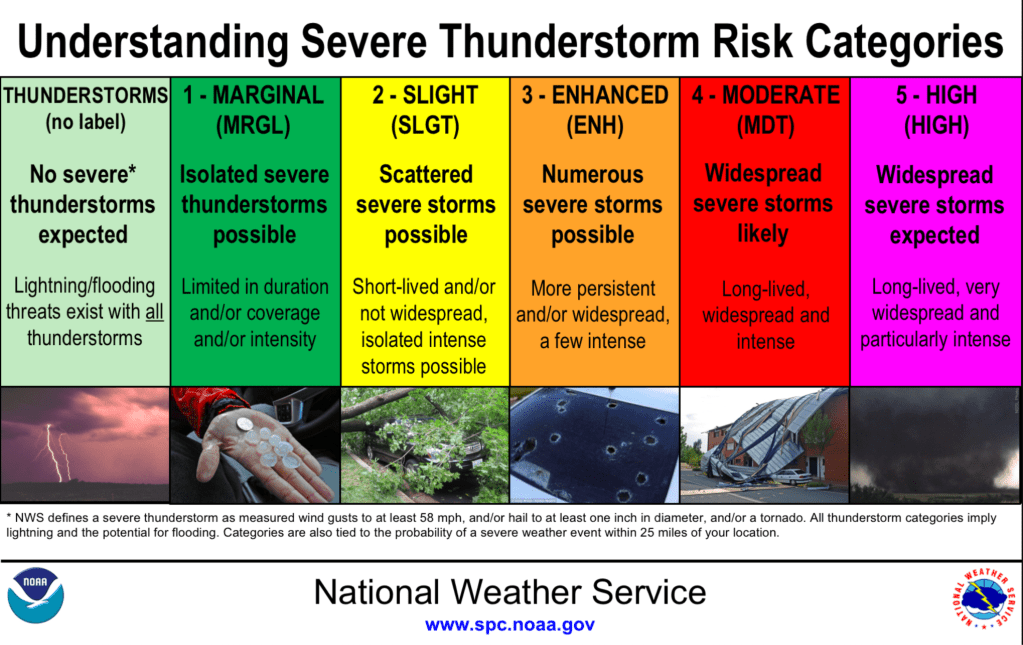
A fairly significant severe weather outbreak looks to be on tap for Louisiana, Arkansas, Tennessee, Mississippi, Alabama and Georgia during Easter Sunday. The Storm Prediction Center has much of the Southern united states under an enhanced to moderate risk of severe thunderstorms as shown above. An explanation of these risk categories can be found below:
The set up for tomorrow is particularly potent as the ingredients for severe weather come together over the southern United States:
The charts below demonstrate those ingredients in action. These charts are looping from 8am Sunday through 8pm Sunday.
MOISTURE: The first ingredient is copious moisture surging out of the Gulf of Mexico into much of the Southern United States. The chart on the right shows this with 60+ degree dew points moving north throughout the day on Sunday. This moisture will provide the fuel for thunderstorm development during the day.
UPPER LEVEL JET DYNAMICS: Secondly we have a very strong jet max punching into LA, MS, AR, TN with the favored left front quadrant (where all the upper level divergence is) making its way into LA/MS/AR. The strong upper level divergence will cause strong surface convergence (create a “vacuum” at the top of the atmosphere, air rushes in and up to fill it) and vertical ascent which will aid the formation of thunderstorms.
STRONG DIRECTIONAL AND VERTICAL WIND SHEAR: If you look closely at the chart on the left the wind direction and speed is indicated by the barbs on the map. I have put the wind from three different levels on the chart:
0 Surface Wind (white thin barbs)
0 700 mb Wind (green slightly thicker barbs)
0 300 mb Wind (orange thick barbs)
What this shows you are winds turning strongly with height. If you go from the top of the atmosphere down toward the surface these winds are turning cyclonically which is the twisting motion you want for the development of tornadoes. This is directional shear.
In addition the winds at 300 and 700 mb are way stronger than the near surface winds. If you were to put a paddle wheel (that’s a BIG paddle wheel) between the surface level and the higher level winds the paddle wheel would start rotating being pushed by the stronger winds at the top. This is vertical wind shear or “speed shear”.
So you have 2 types of twisting motion in the atmosphere, once created by directional differences in the wind and the other created by speed differences. These conspire to aid in the development of rotating thunderstorms or “supercells” which can spawn tornadoes.
INSTABILITY: With the approach of the upper level trough you are also quickly cooling the upper atmosphere. This condition creates an unstable atmosphere which allows parcels of air to begin to rise from the warmer earth’s surface into the cooler upper atmosphere. The greater the temperature difference between the surface and the upper atmosphere the more buoyant the air and the more buoyant the air is the easier it is to form thunderstorms. We measure the energy available to spawn and maintain convection by using a value called Convective Available Potential Energy or CAPE. CAPE is sum of the areas within a curve on a vertical atmospheric sounding where the lifted parcel temperature remains warmer than its environmental temperature. The value is expressed in Joules/kg. The longer an air parcel is warmer than its environment temperature the longer it will rise up into the atmosphere. So, larger values of CAPE essentially translate into a parcel of air that is buoyant high into the atmosphere. The chart on the left shows values of CAPE with the cyan colored lines. CAPE values tomorrow across the south will be in excess of 2000 j/kg and there will be some areas that could see CAPE values as high as 4000 j/kg! CAPE values of greater than. 2500 j/kg are associated with very unstable conditions with the strong potential for severe thunderstorms and tornadoes.
Combining some of these ingredients we can create further diagnostic indices that allow us to further evaluate the risk of where tornadic activity may occur. One of the more reliable indicators is the Energy-Helicity Index (EHI). EHI values of over 2.5 usually indicate a high likelihood for tornadic storms. EHI values in excess of 4.0 usually indicate the potential for violent tornadoes to form.
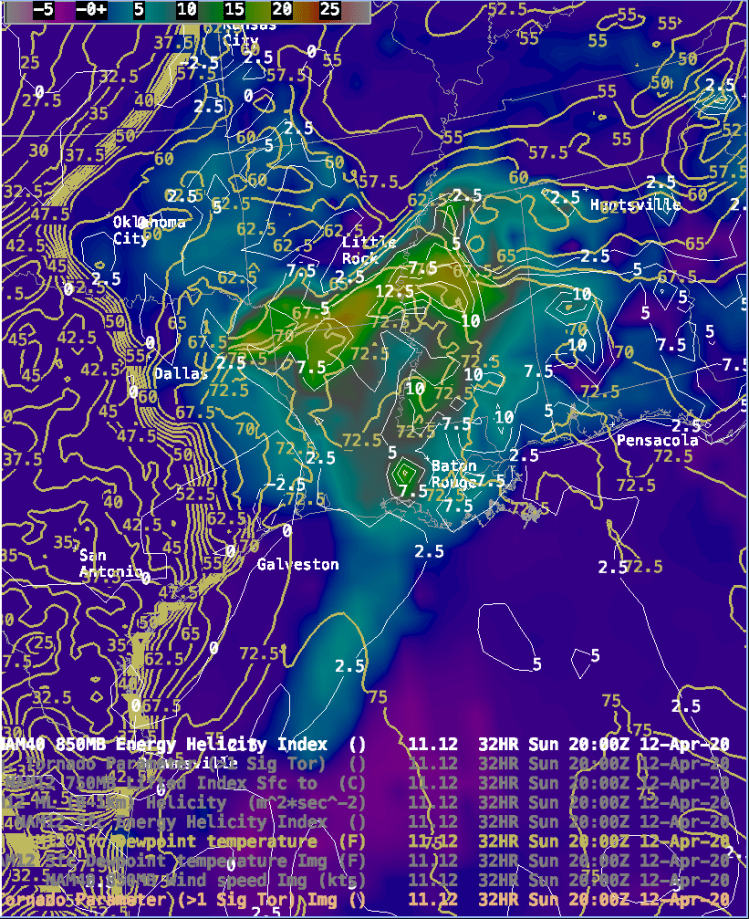
The chart above shows the values of EHI (white lines) across the deep south at 4pm EDT tomorrow. The dew point temperatures (yellowish lines) are also shown here and another parameter called the Significant Tornado Parameter (STP – indicated by shaded areas). The EHI and STP values paint a fairly serious situation for an area from northern Louisiana, across southern Arkansas into western Mississippi around 4pm EDT where EHI values will be at 5 or better. STP values of greater than 2 usually indicate the risk of significant tornado activity. The values in yellow and orange above are well in excess of that threshold.
So, it appears that the greatest risk of widespread tornado activity will start across the states of LA/western MS/southern AR during the early – mid afternoon hours tomorrow and then migrate into MS and AL during the early evening hours. The tornado risk should diminish quickly after about 9-10 pm EDT as the atmosphere stabilizes and the best dynamics push off toward the northeast.
