Issued Tuesday May 19 2020 12:00pm
I can hear you out there now. Where is the %^&^$^%( warm weather!
Patience young Jedi….warm weather is on the way though it is delayed a little bit.
A few forecast posts ago I spoke about the pattern change that we were looking at in the long term. I gave a rather extensive explanation about long and short waves and how they influence the weather pattern in the short and long term. Well, all of that still applies. Additionally, just like the check in the mail, the warm weather is on the way.
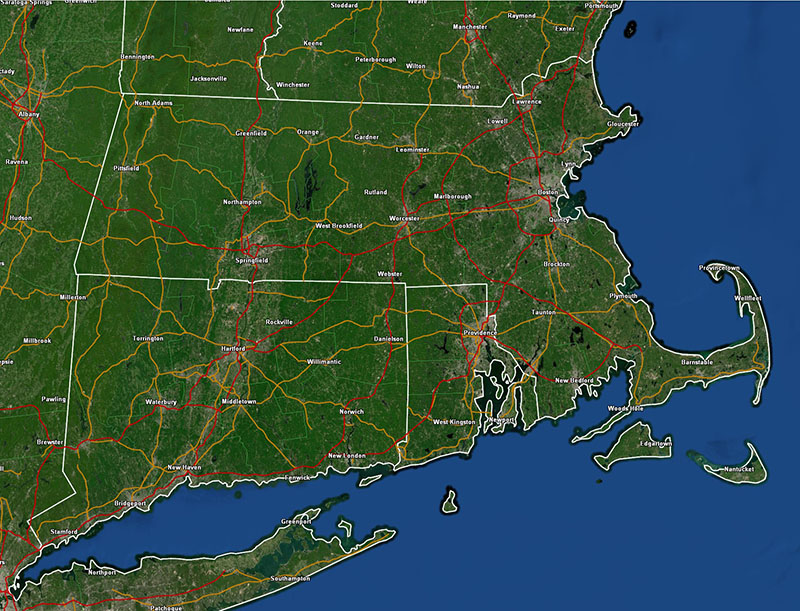
First, let’s look into why we are still so cool. You need not go too far to figure it out either. Let’s look at this morning’s weather map:
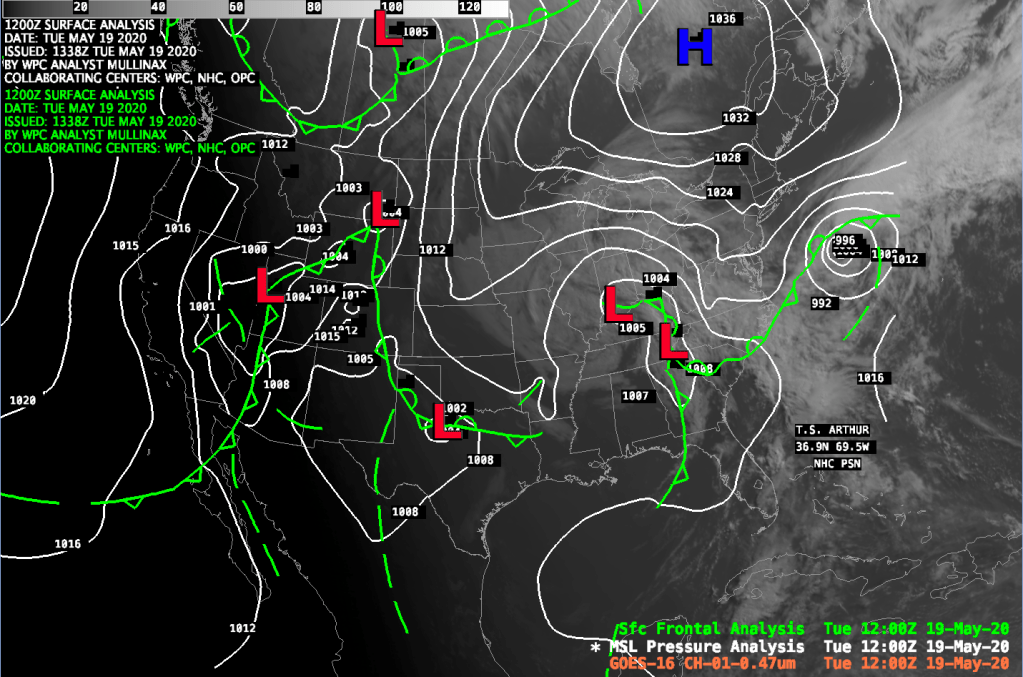
The surface map from 8am shown above paints the chilly picture over the northeastern United States. A large high pressure area over Quebec, which will press toward the SE over the next 48 hours is pumping some rather cool maritime polar (mP) air into the northeast. Add this to a persistent long fetch E-NE wind which is blowing over sea surface temperatures which are in the middle to upper 40’s and you’ve got the recipe for temperatures to be well below seasonal norms. This pattern is a smaller scale low level phenomena as opposed to the larger scale trends we were talking about last week.
What do those larger scale features tell us about our weather? Have they changed? Let’s take a look:

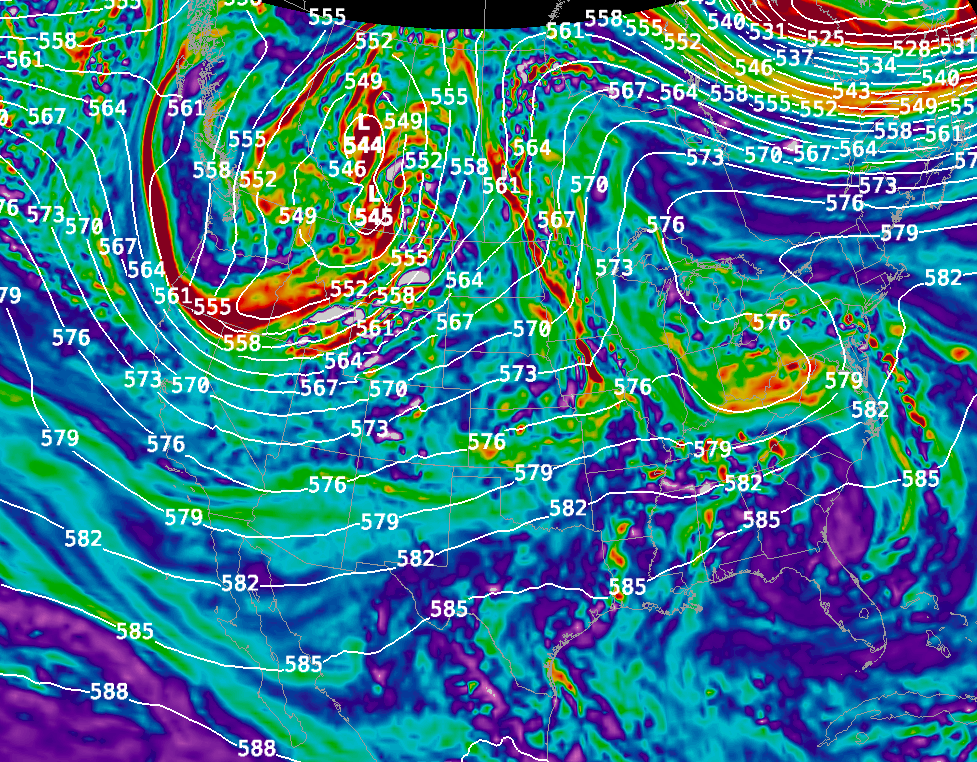
500 mb forecast Longwave Pattern 2pm Today 
500 mb forecast chart (all waves) @ 2pm today
Looking at the two charts above we see that the longwave pattern looks largely like we thought it would. So, on average, given the 500 mb pattern presented we would expect above average temperatures in the east and cooler than average temperatures in the western part of the country. The devil, as they say, is in the details.
The details can be found on the right most chart which represents the 500 mb forecast with short and long waves included. The heavy pinkish line that I’ve drawn on the chart shows where the main 500 mb flow is. As you can see, it looks a lot like the 500 mb long wave pattern shown on the left. What does that mean? It means that the 500 mb long wave pattern that we were talking about last week has evolved exactly as we thought. So why isn’t it warm?? Details…..details. The chart on the right helps to explain why the pattern is the way it is. First, we have what we call a “cut off” low floating over the Tennessee Valley/Ohio Valley region of the country. We call it a “cut off” low quite literally because it is cut off from the main upper level low. This cut off represents a pool of cool air at mid and upper levels of the atmosphere. This kind of low pressure area allows cool and rainy/showery weather to persist over an area over extended periods. Cut off lows tend to form at this time of year as the upper atmosphere is still rather cool from the winter months. As a result, its easier for these cold pools to develop and split away from the main upper level flow. Cut off lows also take a while to exit an area mainly because they are seperated from the primary upper air flow. Essentially, there is nothing to move them along. This cut off, basically gumming up the upper air flow, and the cold canadian high pressure area, which will persist over us for a bit, will combine to keep us in the cool, kind of moist but not that cloudy flow through Wednesday.
So, how does the combination of all these factors influence surface weather?
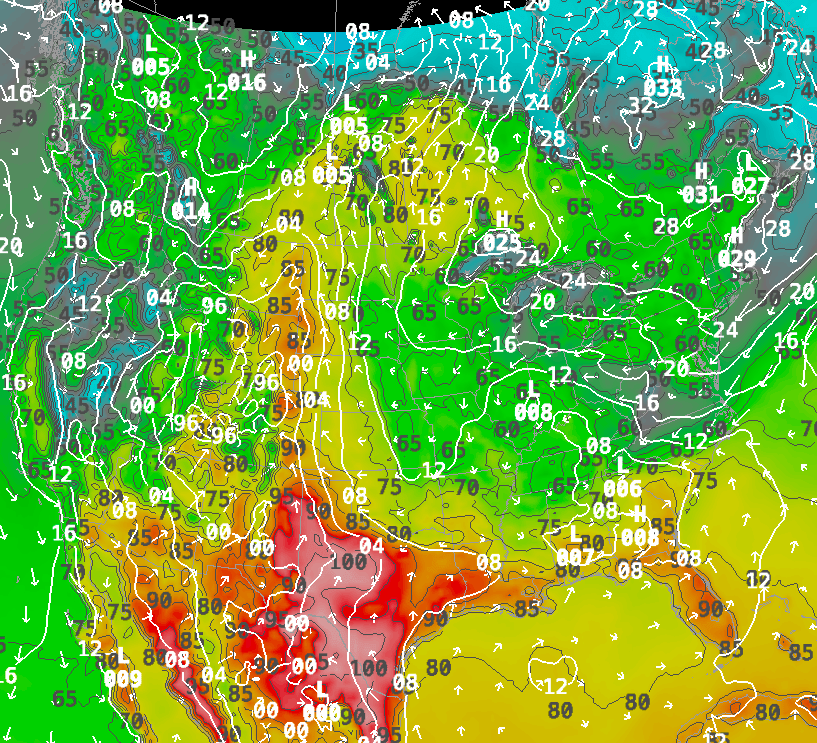
Surface Pressure, Wind Direction and High Temperature for Today (Tuesday)
Looking at today’s high temperature map you can see that is pretty cool over much of the Eastern and Central United States. These cool conditions are a response to the upper level cut off low over the Tennessee Valley and the cool maritime polar air flow coming down from the high pressure to the north of New England. The only warm place in the eastern part of the country is the far SE and Florida panhandle where temperatures are in the mid 80’s to lower 90’s which is about average for this time of the year.
Notice, however, that there is a stretch of rather warm air from Texas right up the spine of the Central and Northern Plains states. This is an expression of the influence of the long wave ridging that is present despite the cool pool that exists over the east. You can also see the cooler weather over the Western United States which is also reflective of the long wave pattern. So, it stands to reason that if we got rid of the transient cut off low pressure area that temperatures would start to respond and warm up. Well, that’s exactly what happens.
By Friday the upper level pattern begins to change as the cut off low gradually fills and becomes an open wave which will allow it to reintegrate all that upper level energy back into the general west to east flow.
500 mb heights and vorticity on Friday May 22 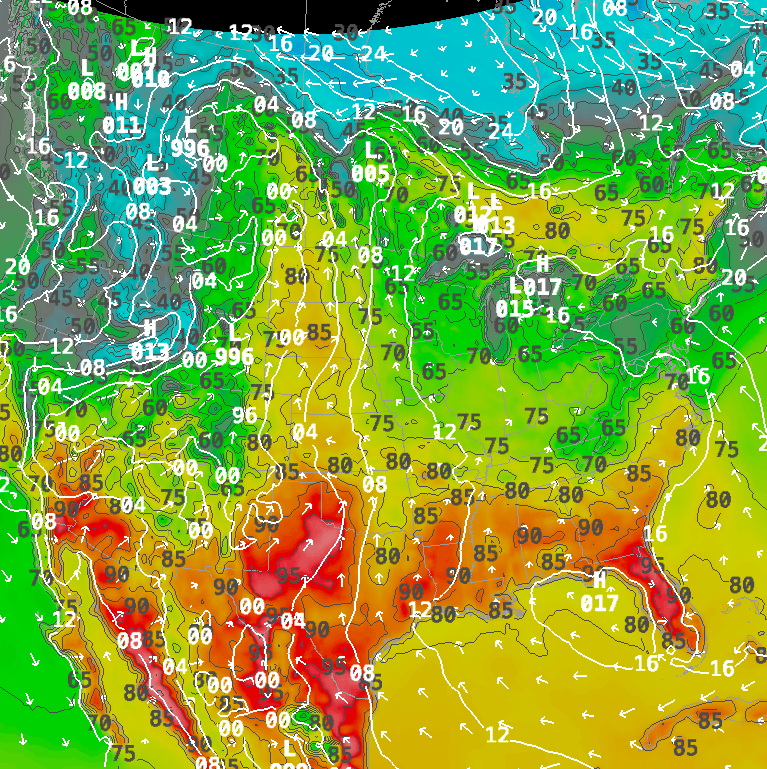
Surface Temps, Winds and MSL Pressure on Friday May 22
On Friday (shown above) we’ve got warming temperatures throughout the east and northeast (except where it will be raining throughout the Mid-Atlantic states). Temperatures in the 80’s and 90’s will expand into the south and Florida will see above normal temperatures especially in the central sections of the state.
So, bottom line, keep the faith. Warmer weather is baked into the current pattern and we will see it. We just need to get the winds to stop blowing over the giant fridge to our east. 🙂
